Edit chart
Loading graph
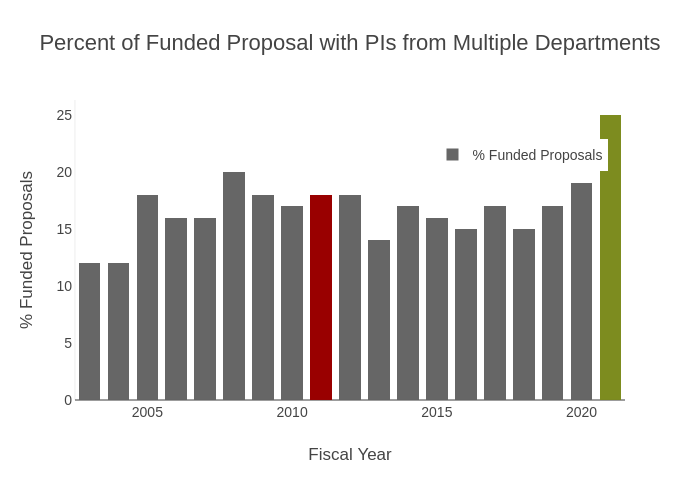
Provostncstate's interactive graph and data of "Percent of Funded Proposal with PIs from Multiple Departments" is a stacked bar chart, showing % Funded Proposals, Baseline, Goal; with Fiscal Year in the x-axis and % Funded Proposals in the y-axis.. The x-axis shows values from 2002.5 to 2021.5. The y-axis shows values from 0 to 26.315789473684212.